Math and the Mouse:
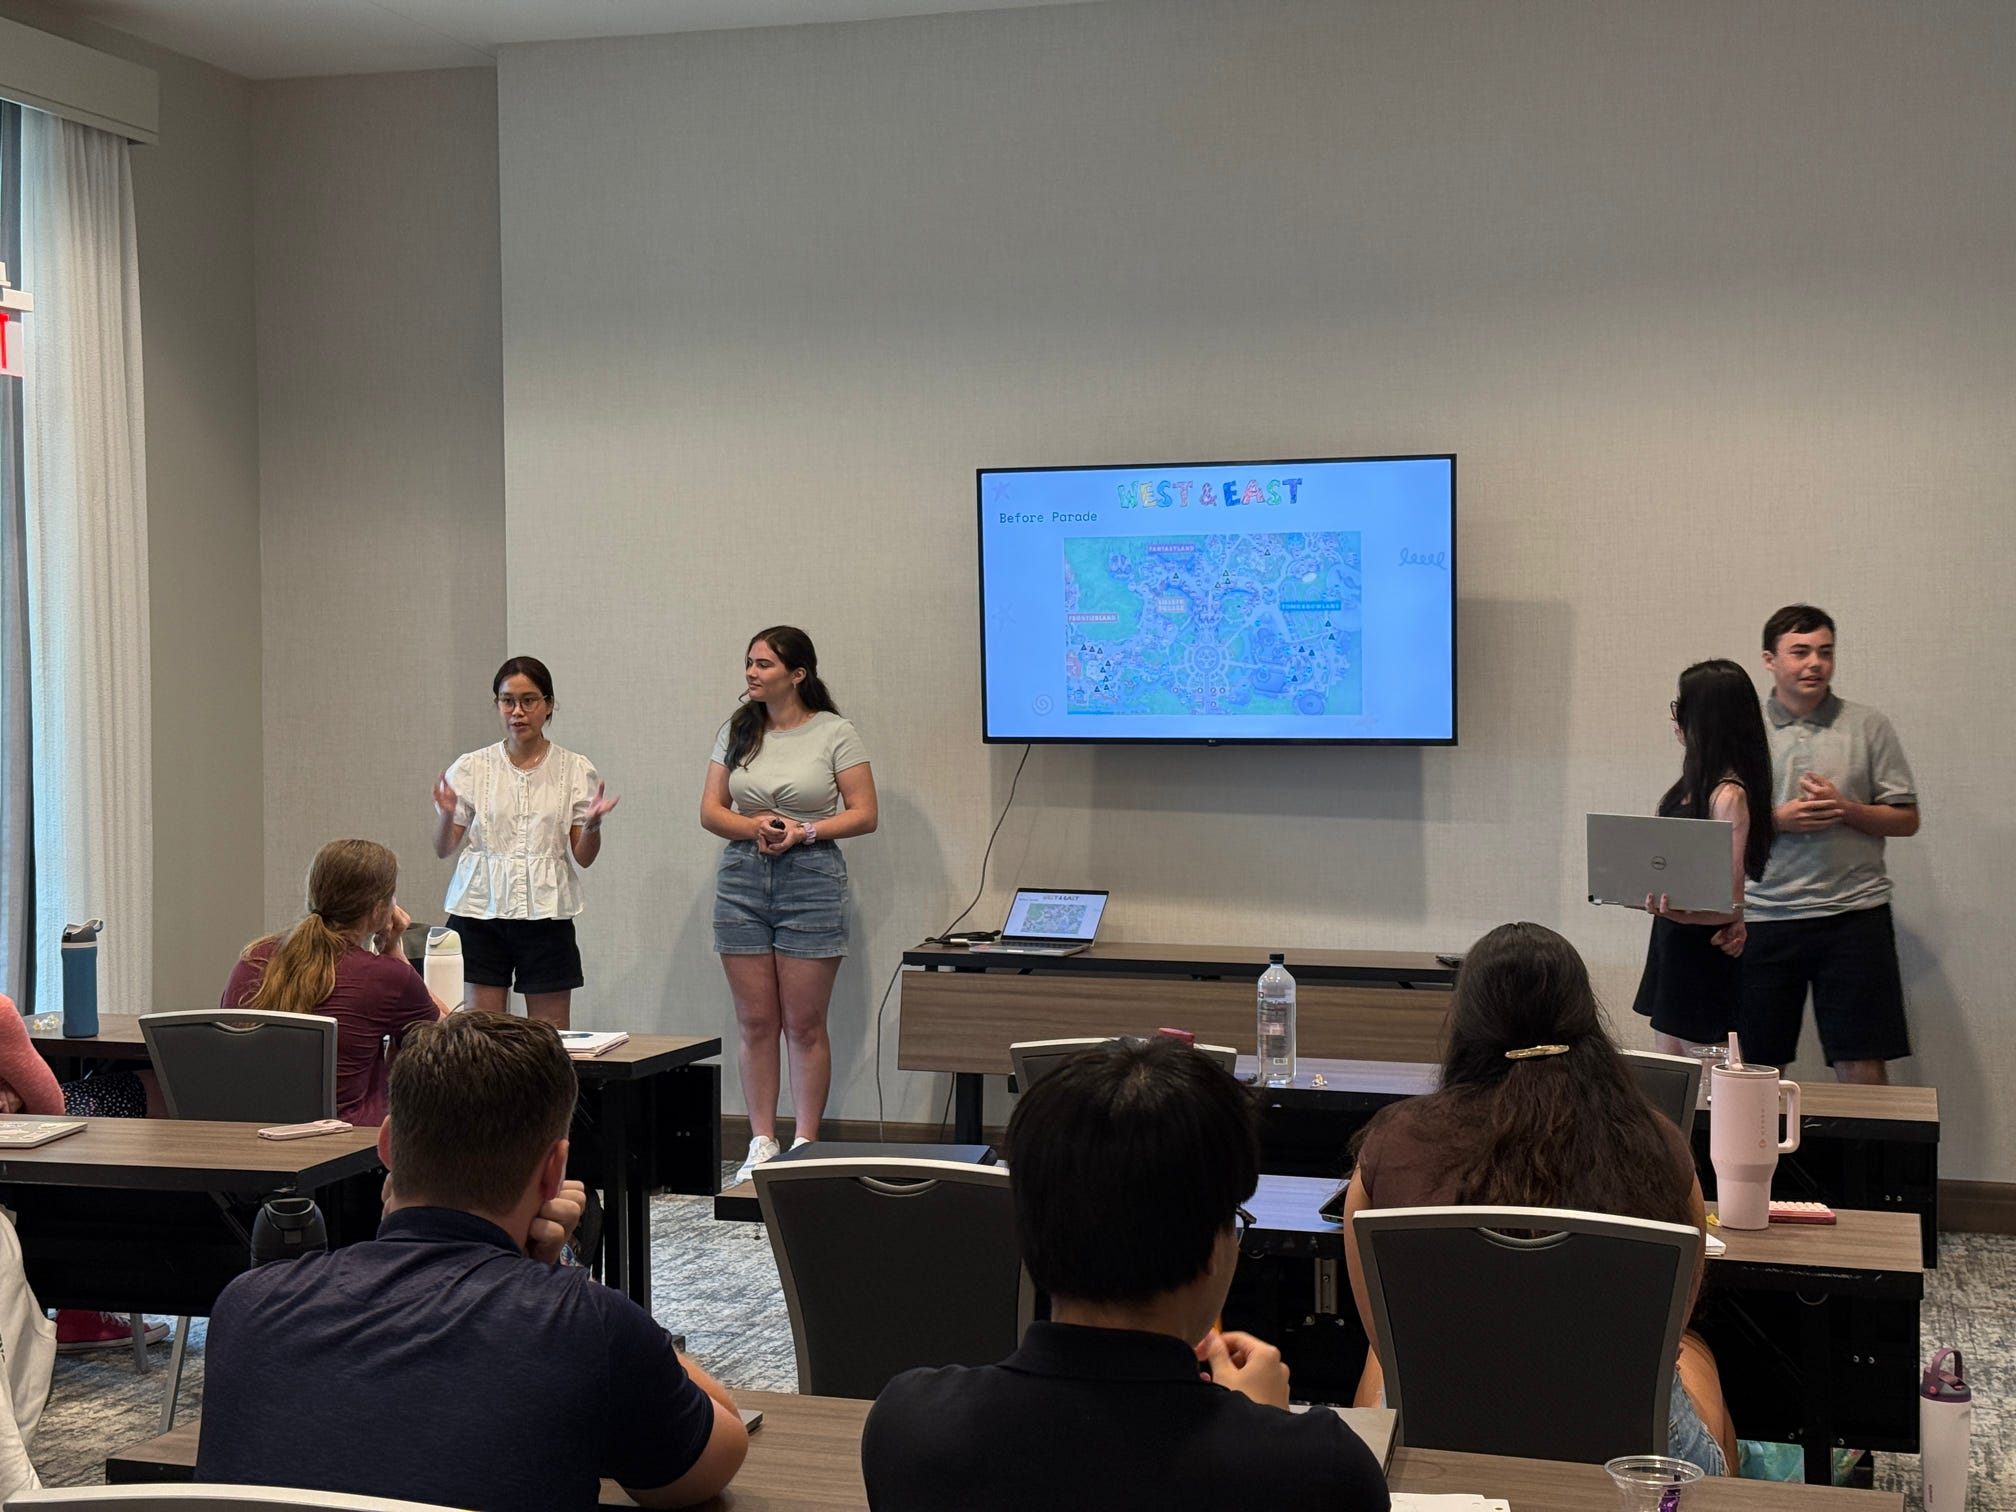
Math and the Mouse is an unique Furman MayX program that I spent three weeks at DisneyWorld to explore mathematical concepts and their applications in the context of DisneyWorld. The program is supported by DisneyWorld and Furman University. Led by Dr. John Harris, Dr. Kevin Hutson, and Dr. Liz Bouzarth, our group of 14 students shared an unforgettable experience filled with discovery, curiosity, and wonder. For me, the program was not only a chance to study math in one of the most creative places in the world, but also a meaningful journey that deepened my appreciation for how mathematics shapes the experiences we enjoy every day.
Study case:
Starting with a simple question for the first week, Where is the optimal location to place a mobile Mickey Bar cart in Magic Kingdom to maximize the number of people who see it? There are three scenarios to consider:
- Two carts on each side of the park (not consider parades and fireworks)
- Cart movement based on ride closure (not consider parades and fireworks)
- Three carts over the whole park (consider parades and fireworks)
Methology:
- Wait time as a proxy for popularity
- K-means clustering to group rides into similar popularity
- Each carts will be assigned to a group and will move to the most popular ride in the group
Specifically, I set up an simple example to understand this approach:
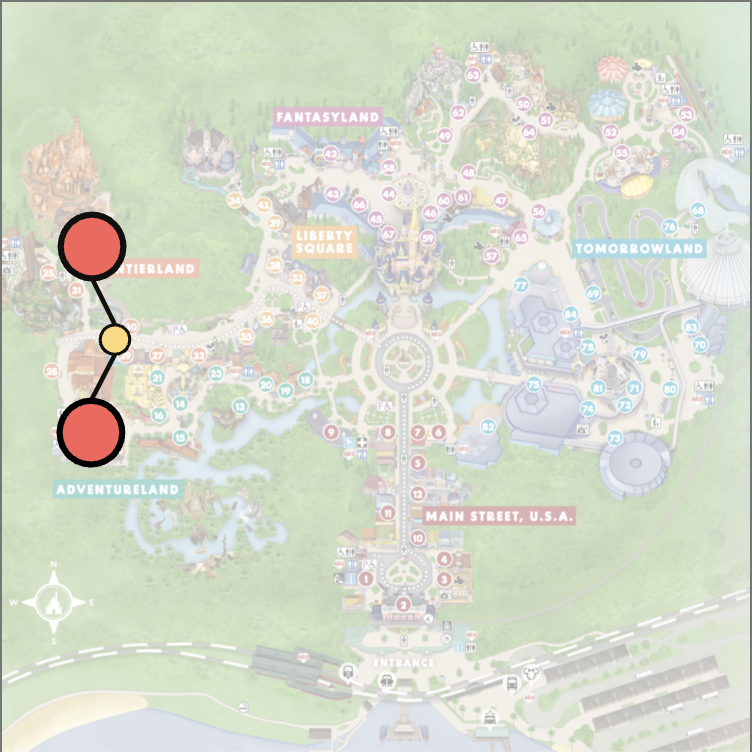
To attract the most people, the cart is best placed in the middle of two attractions without any wait time.
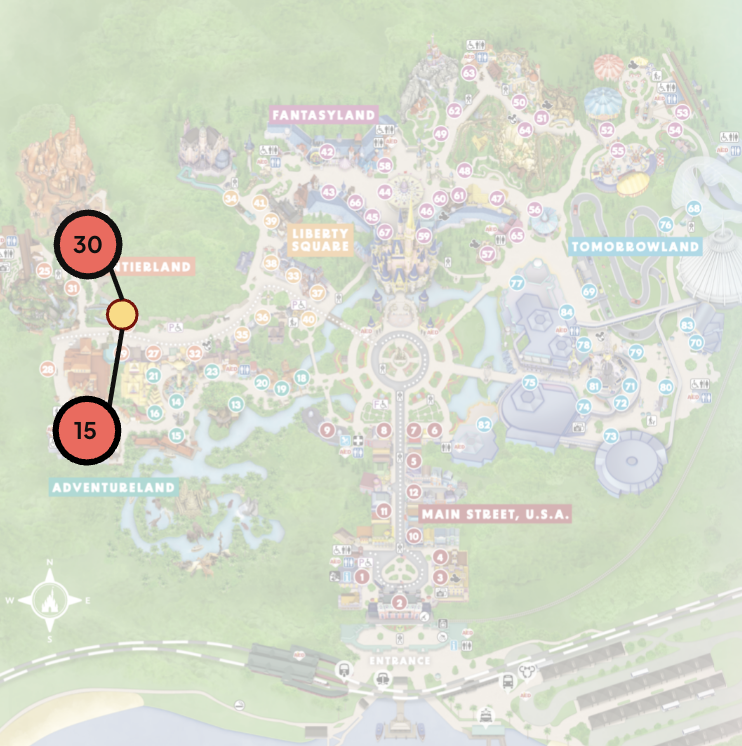
Now, we assigned two attractions with waiting time, one with 10 minutes and the other with 20 minutes. The cart is now moved closer to attraction with 20 minutes wait time.
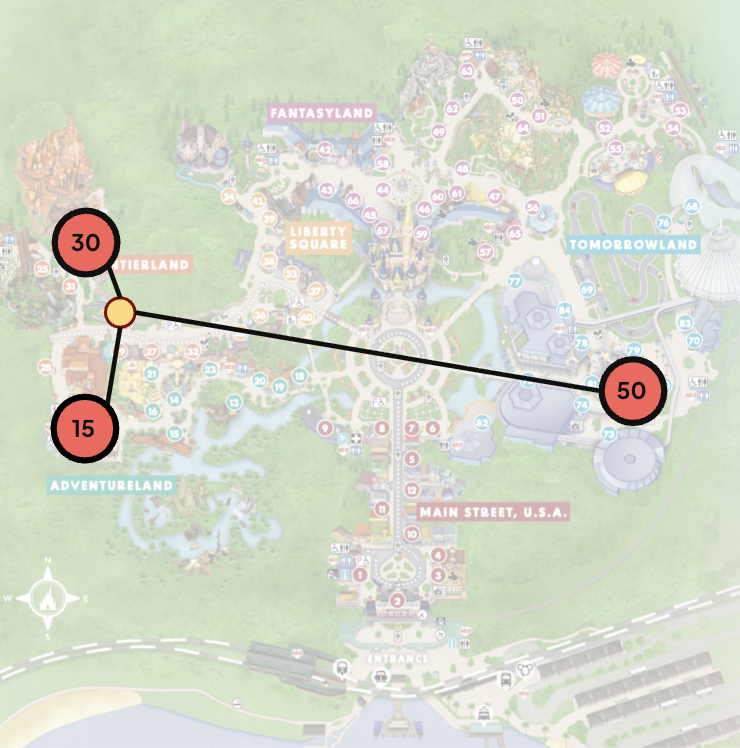
What if we have three attractions with waiting time, one with 10 minutes, one with 20 minutes, and one with 30 minutes? With the one 30 minutes is on the other side the park so the cart stayed the same location. This is because each cart is assigned with specific cart and we use proximity as estimation.
Mathematical Model
1. Decision Variables
2. Binary Variables
- if attraction is assigned to cart (0 otherwise)
3. Objective Function
Minimize weighted distance from attractions to assigned carts:
Mimimize:
Conclusion:
Key Takeaways:
- Cart locations at or near existing food stands which Disney is already doing, supporting the model hypothesis.
- Carts moved for parades and fireworks at certain times of the day..
Suggestions for Future Posts:
- Crowd level adjustments (based on crowd level, the cart will be moved to a more popular area)
- Improve population density estimate (based on the population density, the cart will be moved to a more popular area)
Adjusting the Mathematical Model:
- Proximity to other food/beverage vendors
- Located in typically congested areas
- Middle of walking paths
- Crowding attraction entrances or exits
- Unrealistic movement
Limits of the Model:
- Wait time as density proxy
- Outside Factors: Weather, Multiple ride closures
- Age distribution of guests in different areas of the park